
From last Thursday through to Sunday the Bitcoin price traded in a very narrow range just above the major $75K support level. However, on Sunday the $BTC price fell through the support. It has not collapsed as yet, and a bounce is currently taking place from support at $74. Nevertheless, is this just the prelude to a collapse to below $70K?
Bounce from $74K
Source: TradingView
The short-term chart for the $BTC price is not a pretty sight. Since September it has steadily made lower highs and lower lows, and this has finally culminated in a breakdown below the major $75K horizontal support level. Support has been found at $74K, which is in fact a good support level, given that it rests on the very top of the 8-month bull flag of 2024.
The price action is currently bouncing from this level, and the bulls may be able to push the $BTC price back up to the underside of the parallel channel. However, this could just be for another retest of what is now firm resistance. There is nothing to suggest that the bulls have what it takes to break above this level and push the price up to make a higher high. Therefore, we are probably looking at further downside, which could be a descent to $69K and below.
A retest of the 200-day SMA?
Source: TradingView
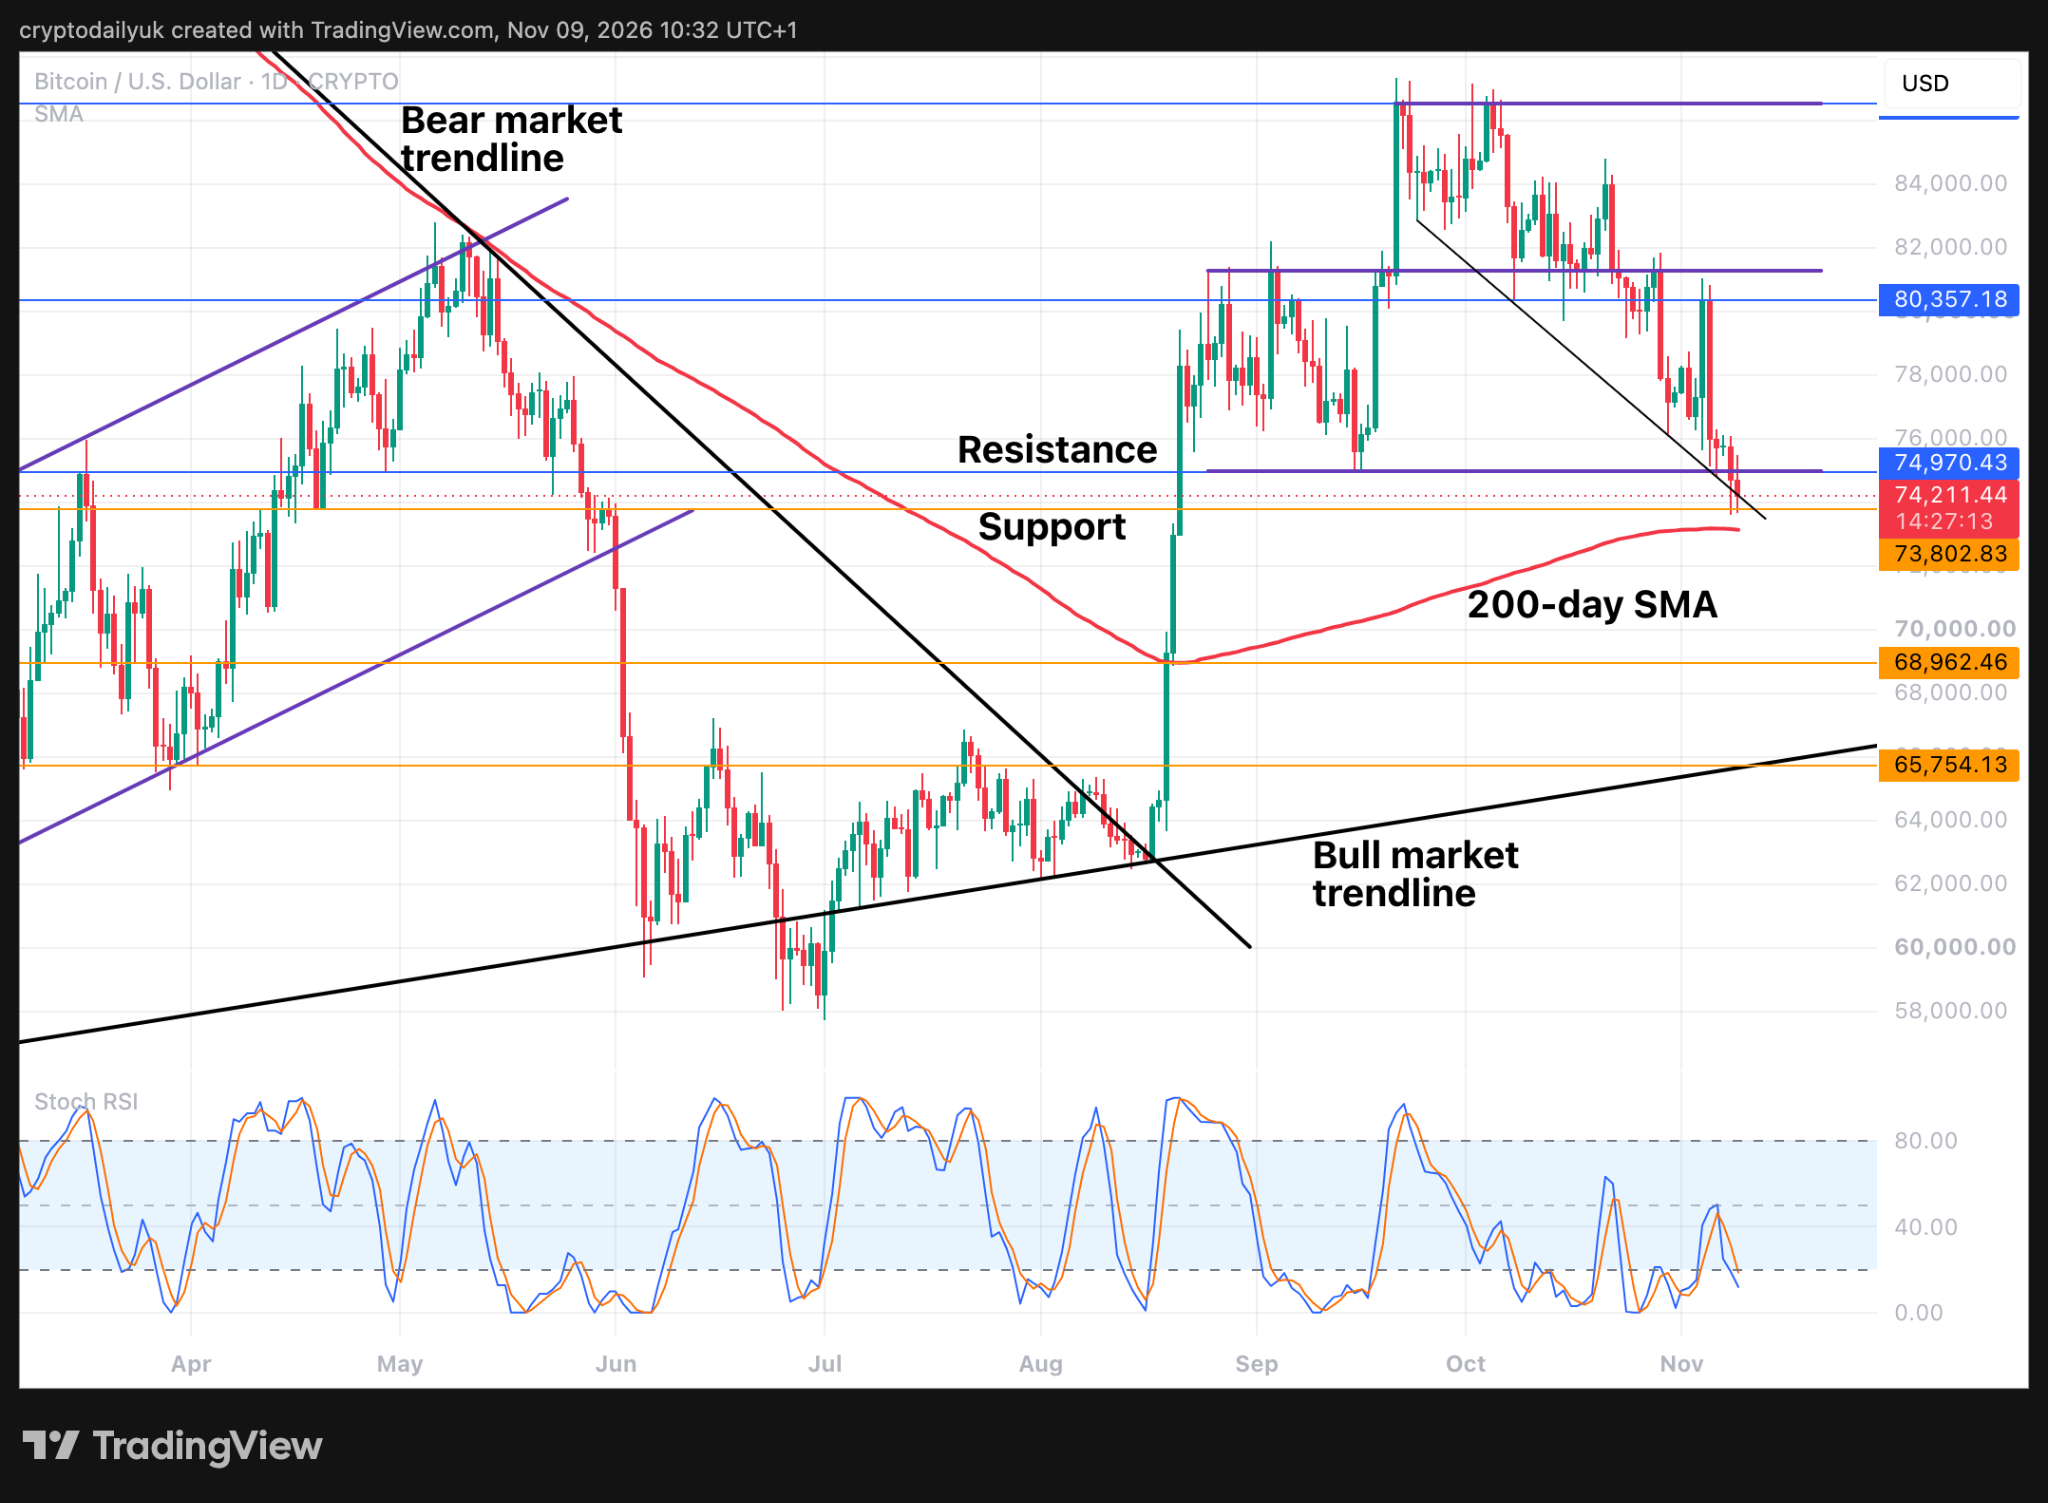
The daily chart illustrates that the $BTC price has almost come all the way down to retest the 200-day SMA. When the price was at the local highs of $87K it really did not look as though it could sink all the way back down to the low $70K region and test this support, but here we are.
We can see if we look left along the chart that the current horizontal level is credible support. There is a descending trendline that has also acted as support for most of the descent. Candle tails have come down below the trendline, but so far the candle bodies are holding above.
Given that the $BTC price has already come down a fair way, it is now to be wondered whether the price will keep going and eventually retest the bull market trendline, which was the main support for the bottom of the bear market. This could take the price down to around $66K.
$BTC price falls below 50-week SMA bull market support
Source: TradingView
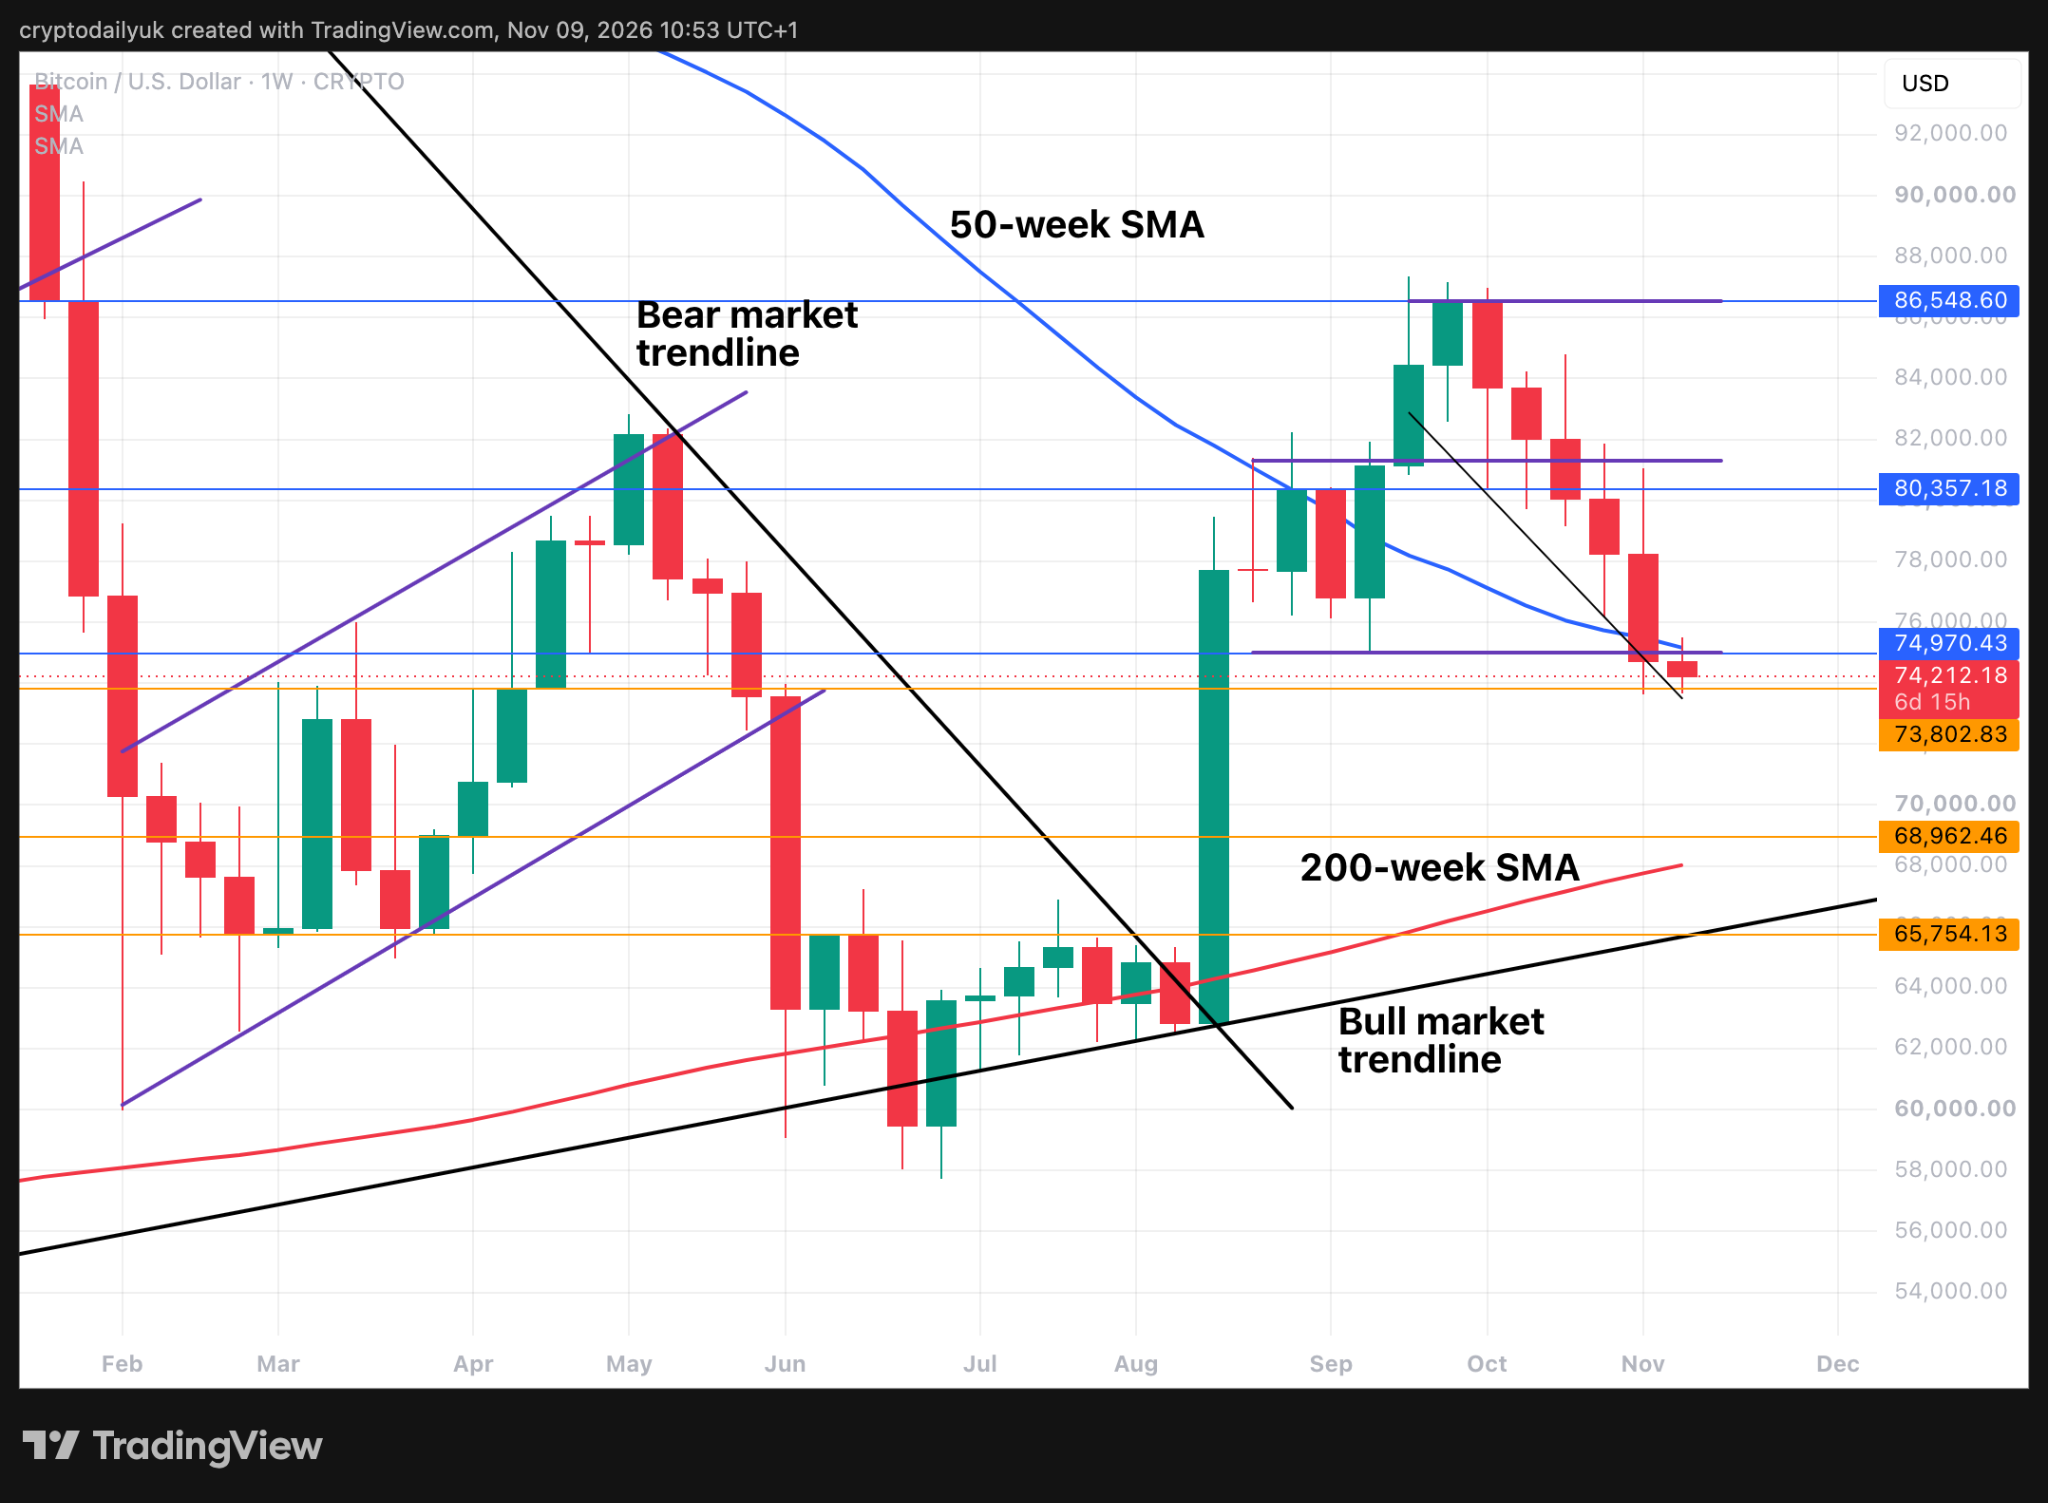
While the $BTC price may indeed hold support at this strong support level of $74K, the signs are that the bear market bottoming process might not be over quite yet. The gap between the price action and the 200-week SMA and the bull market trendline is getting narrower by the week. Could a retest be a possibility? It is for this reason that traders will need to watch the current support level like a hawk. While much was made of $75K, $74K looks like a stronger level, especially on this higher time frame.
Looking at the major moving averages here, this week is going to be huge. The bulls simply must get this weekly candle back above the 50-week SMA. This has acted as bull market support for the last two bull markets. Breaking down and confirming below it could even mean that the bear market is not over yet.
As things stand, as long as there isn’t a vertiginous collapse to come, either the current support, or the next one down at $69K (also testing the 200-week SMA) could be where the trend starts to turn. The U.S. stock market is looking strong on Monday morning as per the Futures chart. Perhaps this can help to firm up the $BTC price. We shall see.
Disclaimer: This article is provided for informational purposes only. It is not offered or intended to be used as legal, tax, investment, financial, or other advice.