


MemeCore [M] has extended its losses with an 11% decline in the past day, but structural analysis suggests the drop may be setting the asset up for a meaningful rebound.
A convergence of bullish factors on the chart points to the current level as a potential launchpad for an upswing, particularly given how close the asset sits to its all-time high.
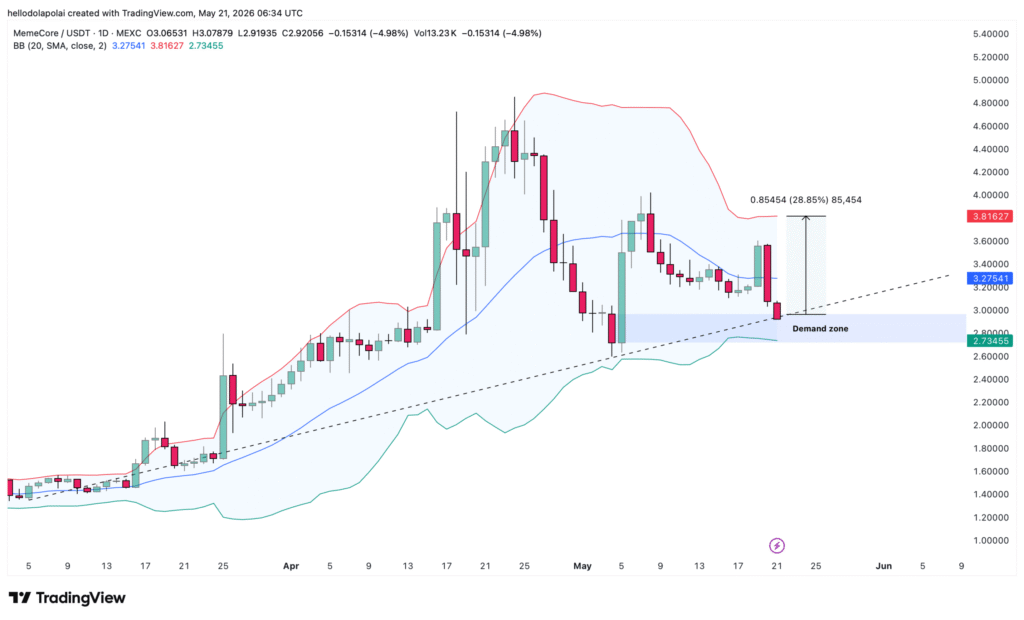
MemeCore trades into a demand order block
The structural setup for MemeCore appears solid at this stage, adding weight to the case for a rebound.
The asset has traded into a correction demand order block on the chart, a zone that has historically delivered rallies to the upside based on prior price behavior.
However, the Bollinger Band levels suggest MemeCore may see further downside before any sustained recovery begins.


The Bollinger Band operates across two key levels, the upper Bollinger Band acting as resistance and the lower Bollinger Band acting as support.
Currently, the lower Bollinger Band falls within the demand order block but sits much lower than the current price, meaning there is still a chance price drops further into the demand zone before staging a rally.
Notably, from a breakout at the demand level to the upper Bollinger Band at $3.8, MemeCore could add a potential 28% return from this rebound.
Spot volume rises 22%
MemeCore’s Spot volume has increased 22% in the past day, reaching $9.44 million, a signal worth examining in the context of the current decline.
The Chaikin Money Flow, a volume-based indicator that measures whether trading volume is driven by buyers or sellers, is trending upward, suggesting buy volume has dominated over the past day.
However, the indicator remains in negative territory, meaning it has yet to fully overcome the selling volume that dominated in the days leading up to this point.

The Accumulation/Distribution indicator has stayed largely flat with a very slight decline, indicating that despite buying volume being more dominant, it has not yet translated into meaningful accumulation of the asset.
Until accumulation picks up, the probability of a sustained rally to the upside remains limited. For now, the rising volume alongside a flat A/D reading suggests bulls are holding their ground but have not yet taken decisive control.
Drop to $2.7 before the rebound takes hold
The liquidation heatmap shows a greater concentration of liquidity below price at the moment, adding further context to the near-term path.
Liquidity clusters mark areas where unfilled orders sit, and price tends to gravitate toward these zones before reversing.


The most significant cluster below price sits at approximately $2.7, which falls within the demand order block identified earlier on the chart.
A drop to this level would likely liquidate early short positions before the rebound tendency reasserts itself, with MemeCore then positioned to make the upswing that the structural setup currently supports.
Final Summary
- MemeCore has traded into a correction demand order block, setting up a potential 28% rally toward the upper Bollinger Band at $3.8.
- Spot volume has risen 22% to $9.44 million in the past day, though the A/D indicator remaining flat signals accumulation has yet to fully take hold.

